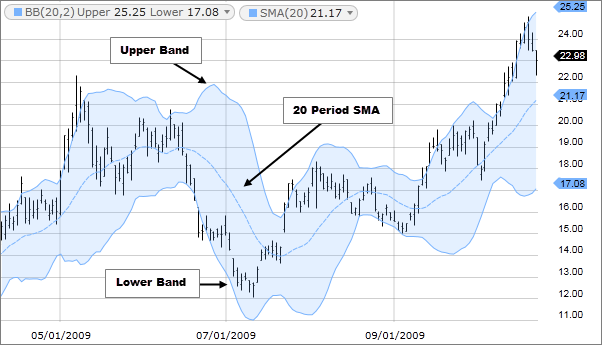
Bollinger Bands are a popular technical indicator used in forex trading to help UK traders identify potential entry and exit points. They are based on the principle of mean reversion, which states that prices tend to move back towards the average price over time. This movement can be seen in Bollinger Band charts, where two bands are placed around an SMA (simple moving average) line – one at an upper level and one at a lower level. The upper band is set two standard deviations above the middle line, while the lower band is set two standard deviations below it.
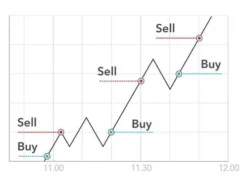
When prices reach or exceed either of these bands, it may signal that they have become too high or too low relative to their recent historical trend. In such cases, traders may consider entering a trade to capitalise on the mean reversion. For example, when prices reach the upper band, they may be considered overbought, and a trader may look to enter a short position. Conversely, when prices reach the lower band, they may be considered oversold, and a trader might look to enter a long position.
Bollinger Bands are also helpful in helping to identify changes in volatility levels. When the bands become narrower (or “squeeze”), it can indicate that prices have not moved much recently and there is relatively low volatility in the market. This indication suggests that there could soon be an increase in activity, as price movements can often come after periods of low volatility. On the other hand, when the bands expand (or “widen”), it can indicate high volatility in the market as prices are rapidly moving around.
Other technical indicators used by UK traders
Other technical indicators UK traders use are the moving average convergence divergence (MACD) and relative strength index (RSI).
The moving average convergence divergence (MACD)
The moving average convergence divergence is a technical momentum indicator that uses the difference between two EMAs to identify changes in market trends. When the MACD finally crosses above the zero line, it signals an uptrend, while when it crosses below, it can signify a downtrend.
The relative strength index (RSI)
The relative strength index (RSI) is also a much-used technical indicator used by UK traders to assess how overbought or oversold a particular security might be at any given time. The RSI compares recent gains and losses in price to determine whether current prices are too high or too low relative to their recent history. RSI is calculated by taking the average gains in a given period and dividing it by the average of all losses during that period. A reading below 30 indicates that the security might be oversold, while a reading above 70 signals that it may be overbought.
Technical analysis vs fundamental analysis
Technical and fundamental analysis are two different methods traders use to make trade decisions. Technical analysis involves studying price movements and patterns, while fundamental analysis is focused on analysing a company’s financial statements and other information. Both techniques can be helpful when trying to identify potential trading opportunities. However, many UK traders tend to favour the technical approach as it offers more specific signals in shorter timeframes.
The bottom line
Bollinger Bands provide a valuable tool for traders to help identify potential entry and exit points based on price movements relative to their recent historical trends or changes in volatility levels. Traders should use them with other technical indicators and fundamental analysis to paint a complete picture of the current market conditions and suggest future price movements. By combining multiple indicators and analysing various sources of information, traders can make better-informed decisions regarding how to trade. The key takeaway is that Bollinger Bands are essential to any successful trading strategy. Novice traders interested in forex trading should take some time to learn about the indicator and practice using it in their trading plans. In this way, they can build a successful track record of profits over time.


